Sam Werner · 22 September 2026
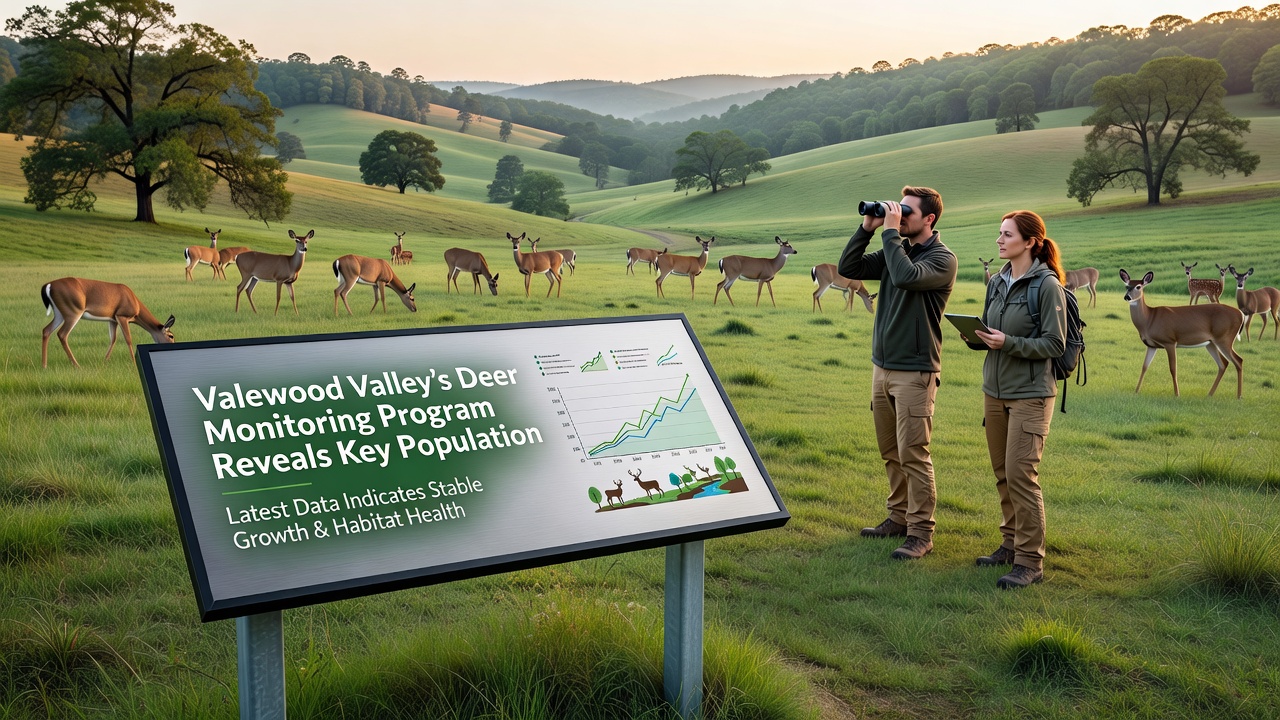
Valewood Valley's Deer Monitoring Program Reveals Key Population Trends
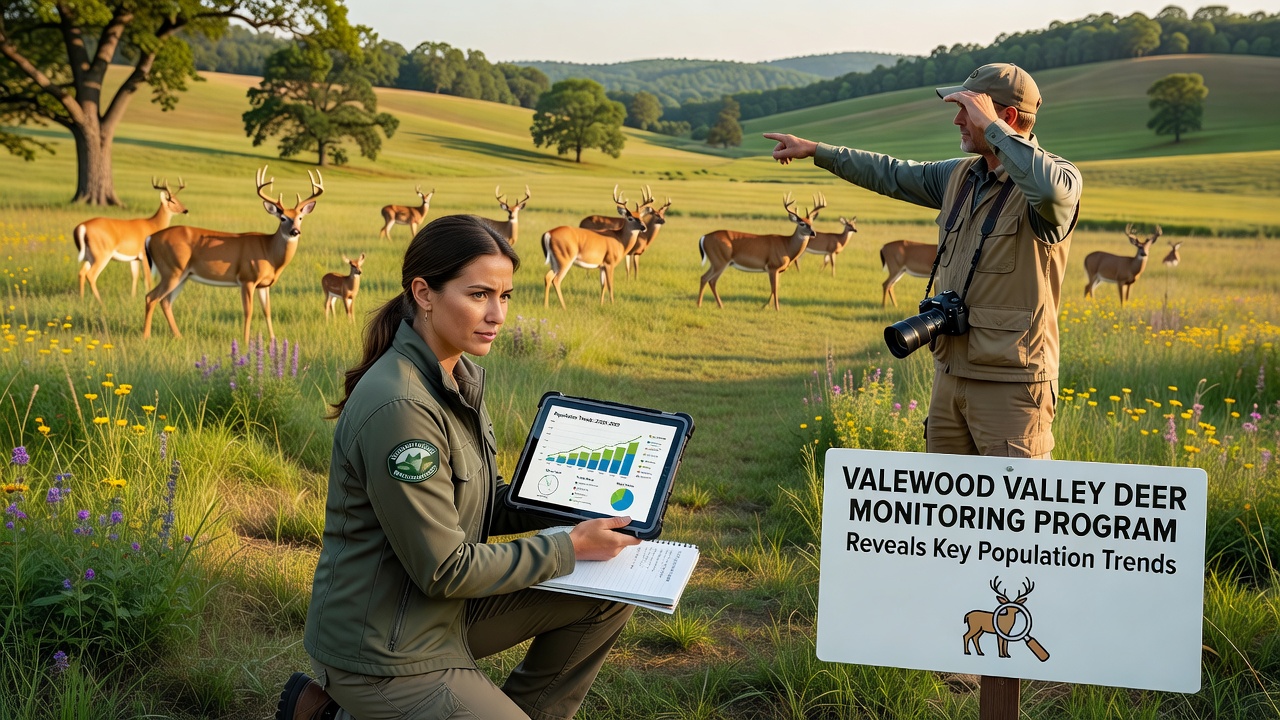
Valewood Valley's deer monitoring program has tracked white-tailed deer populations across the region since 2018, and recent data released in September 2026 shows steady growth in several key zones while highlighting shifts in distribution patterns. Researchers from the Valewood Wildlife Institute coordinate the effort, which combines trail cameras, GPS collaring, and aerial surveys to gather information on herd sizes, movement, and health indicators throughout the valley's mixed forest and grassland habitats.
Program Methods and Data Collection
The monitoring initiative relies on a network of 150 remote cameras placed at strategic points along migration corridors and feeding areas, while wildlife technicians fit select animals with GPS collars that transmit location data every four hours. Aerial counts conducted twice each year supplement the ground efforts, and the combination allows observers to cross-reference numbers and reduce estimation errors. In September 2026 the team completed its latest full-cycle analysis covering the period from 2020 through mid-2026, producing maps that illustrate both population density and seasonal range use.
Technicians process thousands of camera images each month using software that identifies individual deer by antler patterns and coat markings, creating a growing database that now exceeds 12,000 unique records. This approach yields precise counts that field biologists compare against historical benchmarks from earlier decades when less systematic methods were in use.
Population Trends Identified in 2026 Report
Figures released in September 2026 indicate the overall valley deer population has increased by approximately 18 percent since 2020, with the strongest gains occurring in the northern ridges where forest regeneration has improved forage availability. Southern lowland areas show more modest growth, yet researchers note a slight expansion in fawn survival rates there as well. Data shows that average group sizes observed at winter yarding sites have risen from 12 to 15 animals, suggesting improved winter habitat conditions across multiple townships.
Age structure analysis reveals a balanced distribution, with yearlings comprising roughly 22 percent of the sampled population and mature bucks accounting for 14 percent. These proportions align with patterns documented in similar temperate ecosystems, and they point to consistent recruitment without signs of overpopulation stress such as reduced body weights or higher disease incidence.
Factors Influencing Distribution and Growth
Habitat changes play a central role in the observed trends, as abandoned agricultural fields revert to shrubland and provide additional browse during spring and summer months. Predation pressure from coyotes remains stable according to separate tracking studies, yet deer appear to adjust movement patterns to avoid higher-risk zones near roadways. Climate data collected alongside the wildlife observations show milder winters in recent years that have reduced snow depth and thereby improved access to ground forage, contributing to higher survival rates especially among younger animals.
Human activity also shapes outcomes, since regulated hunting seasons remove a consistent number of animals each fall while vehicle collisions continue to represent a measurable source of mortality along major routes. The monitoring team collaborates with local transportation departments to identify collision hotspots and recommend signage or crossing structures where data indicates elevated risk. One study from the United States Geological Survey links similar landscape features to increased deer-vehicle interactions, and Valewood researchers apply those findings to refine local mitigation efforts.
Management Implications and Future Monitoring
Resource managers use the September 2026 findings to adjust harvest quotas in zones showing rapid population growth, aiming to maintain ecological balance without abrupt changes that could affect hunter participation or community traditions. The program also supplies baseline information for habitat restoration projects funded through federal and provincial partnerships, including work that targets invasive plant removal and native tree planting to enhance long-term forage quality.
Additional sensors now being tested will measure temperature and humidity at camera sites, allowing future reports to correlate microclimate variations with deer behavior more precisely. Plans call for expanding the collar sample in 2027 to include more does, which will improve understanding of fawn-rearing success across different elevation bands within the valley.
Conclusion
The Valewood Valley deer monitoring program continues to deliver detailed, location-specific information that supports both conservation planning and public safety measures. As the September 2026 dataset becomes integrated into regional wildlife models, it joins a broader body of knowledge that includes work by Environment and Climate Change Canada on ungulate responses to changing seasonal conditions. Ongoing data collection ensures that future reports will track whether current growth rates persist or stabilize, providing the factual foundation needed for adaptive management decisions across the valley.